

ADD UPDATE, 2 May 2017, Bruce Mitchell, resident of Fair Oak: The document ‘Eastleigh Strategic Development – Options B and C, Strategic Site Rationale and Proposed Delivery Strategy’, published last November by developers Highwood and Drew Smith (and favoured by Eastleigh Borough Council), lays out in rosy developers’ and politicians’ language the reasons why the rolling landscape north of Fair Oak and Bishopstoke should be filled with houses and cars and tarmacked over. It exudes the usual positive glow of this sort of document, talking about ‘enhancing, reinforcing, creating, providing, delivering’ all sorts of putative benefits to the people they hope will be drawn in to buy from them at hugely inflated costs. Oh, and also to the existing communities who treasure the woodland and countryside walks as they currently stand.
But the presentation style is disingenuous and needs to be recognised as such and discounted.
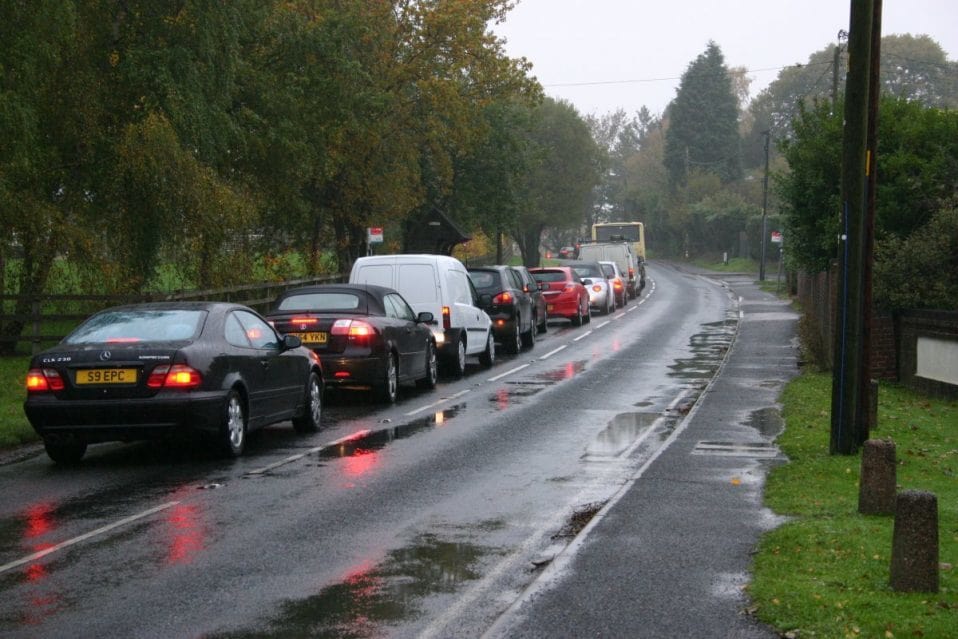
It is claimed that the proposed ‘strategic relief road’ will ‘remove traffic, provide relief, reduce volumes…’ It might, were the road to be built in isolation. But it will not be. It is foreseen as a component of a huge building project delivering 6,200 homes – and would, in any case, be severely hindered by the low and narrow Allbrook railway bridge at the west end, which Network Rail has no plans to expand.
So, what does ‘remove, reduce, relieve’ actually look like?
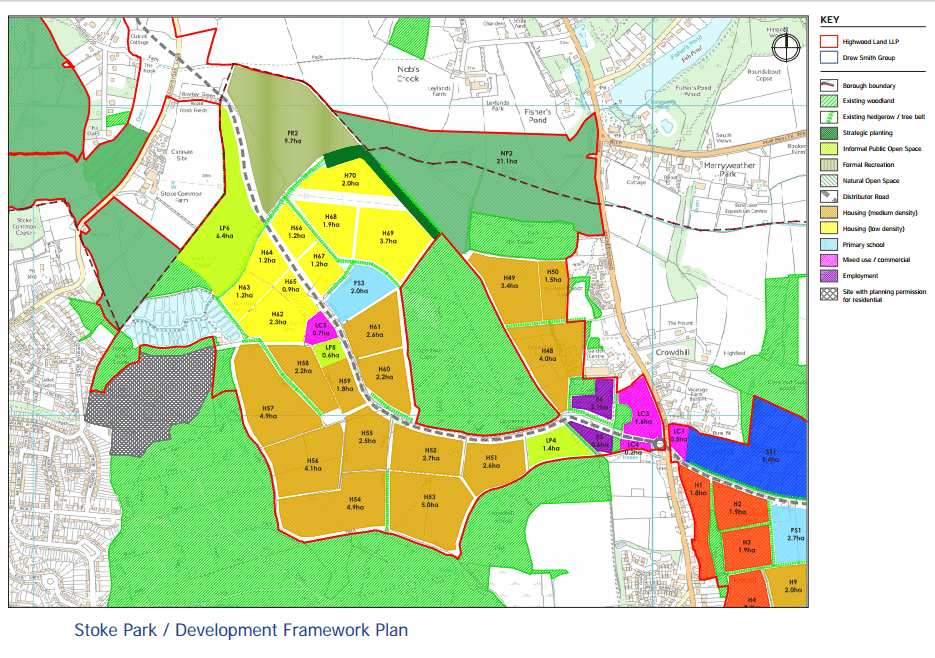
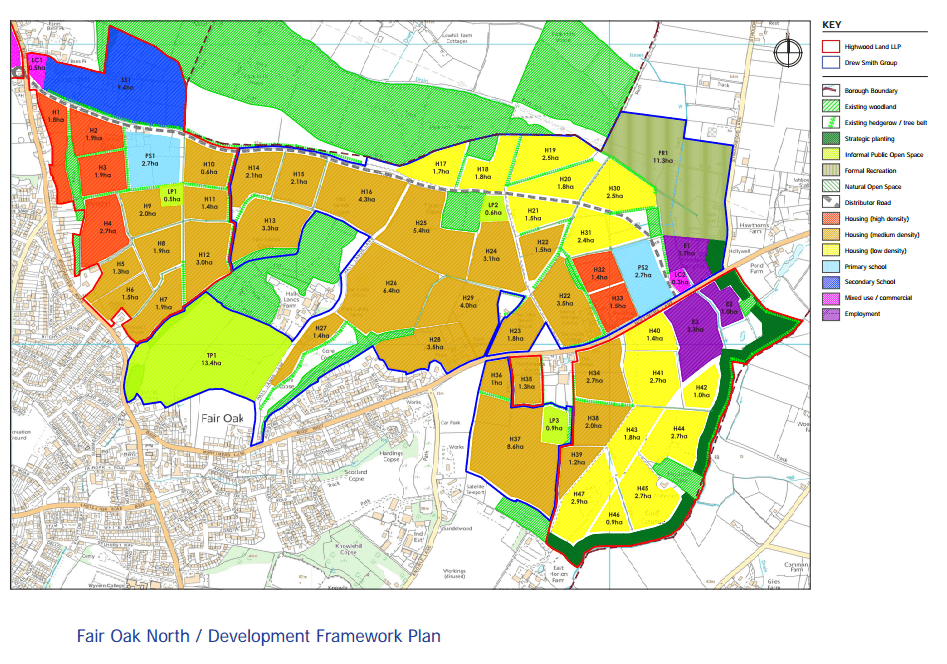
Although some of the development within option B (medium- and low-density housing parcels H54-H70 + primary school – see map here) would be located within the boundaries of Bishopstoke parish, it would not be organically connected to Bishopstoke village. Instead it would be linked to the majority of the rest of the plan (high-, medium- and low-density housing parcels H1-H53+ primary school + secondary school – see map here), which is destined for the parish of Fair Oak and Horton Heath.
Given this, and the fact that the development’s proposed connection with Eastleigh would be provided by the new road through Allbrook, it seems appropriate to discuss the impact of the plan in terms of statistics for Fair Oak and Horton Heath parish rather than those for Bishopstoke parish.
According to the 2011 Census, the Parish of Fair Oak and Horton Heath has the highest average household (HH) size of the eleven council areas within the Borough of Eastleigh (2.25 persons per household) and the second-highest average rate of cars or vans per household (1.68 [6,768 vehicles]). The average rate across the Borough of Eastleigh was 1.5 cars or vans per household, well above the national average of 1.2. This is because people living on the urban fringe or in the countryside are more dependent on private transport than people who live in town or city centres.
On the basis of these parish averages, the 6,200 extra households delivered by options B and C can be expected to increase the population by an estimated 15,750 persons (2.54 x 6200 HH) and to add 10,416 vehicles (1.68 x 6200 HH) to the roads – on top of 1,790 persons and 1,190 vehicles already coming from developments at Crowdhill Green (330 houses), Pembers Hill Farm (250), Mortimers Lane (46) and Carnaval Gardens (78) on the corner of Knowle Lane and Mortimers Lane (1.68 x (330+250+46+78 HH)).
This would take the number of cars and vans in the parish from 6,768 in 2011 to 18,397 – 272% of the 2011 number. The idea that all these will only ever go along that new road and into Eastleigh is preposterous.
The evidence suggests the proposed ‘relief road’ is doomed to fail!
NOTES
Table for the Output Area statistics for population and household size:
- Usual residents (In household (HH) and communal establishments (CE)
- HH count
- Average HH size (persons per household)
- Census output area (OA) area (m2)
- Population density (persons per square kilometre)
Table for the Output Area statistics for car or van availability:
2011 Census: Table KS404EW – Car or van availability (from NOMIS)
- All HH
- No cars or vans in household
- 1 car or van in household
- 2 cars or vans in household
- 3 cars or vans in household
- 4 or more cars or vans in household
- Sum of all cars or vans in the area
Extracts were drawn from these two tables for Eastleigh Borough, at Census Output Area level. They were then merged using OA code, and aggregated up to parish level, on the basis of the population-weighted centroids of Census Output Area – as specified by the Office for National Statistics’s best fitting procedure.